
USING COUNTER REPORTS
How To Work With COUNTER Reports
Whether you’re manually downloading tabular reports or harvesting JSON files through the COUNTER API, this guide is the place to start when working with COUNTER reports. It’s filled with hints from librarians about how to filter, pivot, and generally manipulate the data to answer your key questions.

Introduction To Using COUNTER Reports
This guide introduces key aspects of using COUNTER reports. We cover file formats and how to access your reports if you prefer working in spreadsheets, how to use the COUNTER API (formerly known as sushi) to set up automated harvests into your data management tool, and of course, how to use COUNTER metrics to answer common questions about electronic resource usage.
The COUNTER Academy, our in-depth online learning offering, goes into a lot more detail on how to work with COUNTER Reports. If you’re interested in the Academy, register here.
Download Translations
Translations of the Friendly Guide are available in five languages, thanks to the generosity of members of the COUNTER community who provided funds and time to help us produce them.
- SpringerNature funded our Chinese translations
- Thieme sponsored German translations
- Gale covered the costs of our Spanish translations
- Thanks to the Couperin Consortium and the Canadian Research Knowledge Network for French translations
- And to Yuimi Hlasten at Denison College for Japanese translations
The Details
File Formats
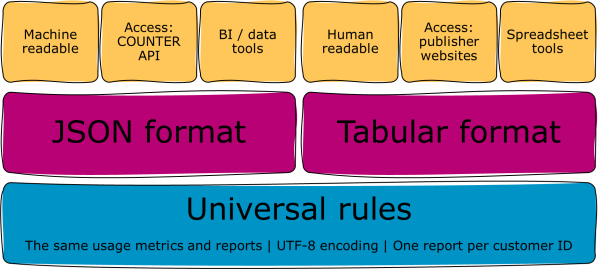
All COUNTER Reports and Standard Views of COUNTER Reports have to be available in two formats. The first is our machine-readable JSON schema. The other format is tabular.
JSON files are machine-readable and look a bit like code. JSON files are accessed using the COUNTER API. Business intelligence and data tools, like Power BI, ingest JSON files and ‘translate’ the data into human-readable formats and charts. A lot of library services can automatically harvest our JSON files and visualise the data in dashboards.
Tabular files can be opened and read in all the usual spreadsheet programs, including Excel and Google Sheets. Our tabular reports are usually Tab Separated Value (.tsv) or Excel (.xlsx) files, though some publishers offer Comma Separated Value (.csv) too. We don’t recommend .csv because the presence of commas in metadata fields, like book titles, can create problems when you pull the file into a spreadsheet. You can get hold of tabular files through publishers’ library administration portals. You’ll have to manually request them, because there are no automated harvesting tools for tabular reports. Tabular files are often easier for humans to work with than a JSON file.
What Do COUNTER Reports Look Like?
As we’ve already said, COUNTER reports come in two formats: JSON and tabular files. Formatting, in the sense of typeface and colour, is irrelevant in both formats. However, we do ask publishers to stick to a standard structure. We also ask for UTF-8 encoding. UTF-8 helps ensure reports can preserve special characters (like â or ö), whichever file type is delivered.
Typically, publishers create COUNTER reports on a per-customer ID basis. The exceptions to this per-customer rule are open access and consortia reporting. That means if you’re accessing reports, they’re going to be for your institution.
If you want to know the details of what appears in different COUNTER reports, jump over to the Reports Guide, or take a look at the samples of both JSON and tabular formats in the Code of Practice. Right now we’re only looking at structure!
Report Headers
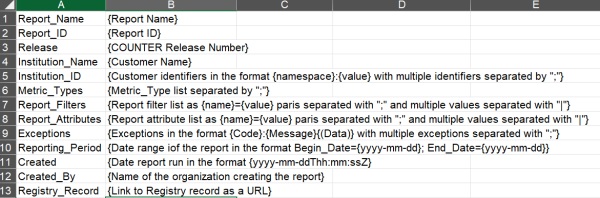
Starting with Release 5 there have been twelve fields that show up in all COUNTER report headers. These start with five fields about the report: report name and identifier, release number, and institutional name and identifier. Then we have four fields to identify key information included in or excluded from the report: the metric types, filters and attributes you can expect to see, and any exceptions that the publisher wants you to be aware of. After that are two date fields highlighting the period covered by the report, and the date it was created. Finally we have two fields about the reports validity: the created by field, which identifies the report provider, and a link to the provider’s COUNTER Registry record. We added the Registry link in Release 5.1 to more easily identify COUNTER-compliant reports. I encourage you to check the Registry link whenever you start working with a new publisher’s reports so that you know what their compliance status is!
Report Body
Just as the report header structure is fixed, the bodies of different COUNTER reports follow a formula.
- The content being used. In the Title Report this will be information about the titles (journal, book, etc.), while in a Database Report it’ll be information about the database.
- The platform and publisher details.
- Content identifiers. Also known as acronym central, this is the area of a report where you’ll find Digital Object Identifiers (DOIs), ISBNs, ISSNs, URLs, and proprietary identifiers
- Report attributes. Data Types, year of publication (YOP), Access Types, Access Methods, and Metric Types appear here. It’s a particularly useful section of a report to use for filtering. Check out the Tech Guide if you want more information about attributes.
- Metrics. The reporting period total and month-by-month breakdowns of usage, search and denial metrics. The Metrics guide can help you here.
Harvesting Reports
Configuring A Report Before You Harvest
Whether you are going to harvest a report manually or through the COUNTER API, you need to know what you are calling. As a reminder, we recommend using the Reports and not the standard views!
Some attributes are not delivered by default. You’ll have to select them as part of setting up a harvest.
- Access Method is only included when it’s requested, in all four reports.
- The Title and Item Reports only include YOP and Access Type on request.
- The Item Report skips lots of other data fields, including all of the parent and component information, unless you specifically call for them.
Choosing to include attributes like Year of Publication can make the file size very large. Specifying your report parameters using things like a defined date range (e.g. January to December 2025) can help to control the size of the report files.
Harvesting Using The COUNTER API
The COUNTER API used to be called sushi. Like any other API, the COUNTER API is a software protocol. We designed the API to make it easier for librarians to gather their usage reports in the JSON file format.
Each publisher or technology provider has to configure a COUNTER API-compliant server, unless they’re on our Pathway to Compliance. Librarians use client software to harvest their reports from the server. Client software can be anything from a desktop program to a cloud-based commercial harvesting service. You can even use your browser, though it’s not an optimal choice.
We keep a record of the COUNTER API details for all compliant publisher platforms in the COUNTER Registry. In the COUNTER API section of each record you’ll see the base URL of the platform’s COUNTER API server. You’ll also see information about what kind of authentication the server requires as part of the Registry record. That’s usually a Customer ID, but other security like a Requestor ID or an API Key might be required.
Once you have logged into the COUNTER API server, you can add several paths to the base URL to find out useful information. Most report providers still use the old sushi name in their base URL. For example, https://usage.reporting.service/counter5/sushi/r51/. Using that base URL, the four main paths would look like this:
- Members, which will give you a list of consortium members: https://usage.reporting.service/counter5/sushi/r51/members.
- Status, which will tell you if the COUNTER API service is active: https://usage.reporting.service/counter5/sushi/r51/status. From R5.1 onwards, the Status endpoint is public. You don’t need to log in to use it.
- Reports, which will tell you the COUNTER Reports supported by the COUNTER API service: https://usage.reporting.service/counter5/sushi/r51/reports
- Reports/ReportID, which will deliver a specific report: https://usage.reporting.service/counter5/sushi/r51/reports/{reportID}. For example, /reports/TR will harvest a Title Report.
Harvesting Manually From Publisher Websites
Many publisher platforms offer library administration and subscription management tools, including COUNTER reports, through the website’s user interface. They are available under many different labels, including ‘Information For Librarians’, ‘Manage Your Subscriptions’, ‘Library Administration’, etc. If you choose to download reports through the library administration pages, you will have the option to download them as a tabular file. Some publishers also offer the JSON format for manual download.
We know some of you get stuck on importing .tsv files into Excel! The video below gives a quick overview of how to do that.
- Open a blank Excel file.
- Navigate to the Data tab and select the button “From Text/CSV”.
- Select your report file from the file explorer.
- Make sure the delimiter is set to “Tab” and verify that the column headings are where you’d expect them to be for the kind of report you are working with, then hit “Load”.
- That’s it, your data will be imported to Excel and ready for use.
Troubleshooting
It is an immutable fact of life that things go wrong. It’s just as true for report harvesting as it is in life! If your harvest process breaks down, or something looks wrong in your report, you can use the free COUNTER Validator to troubleshoot. The Validator works with R5.1 and old R5 reports, in both tabular and JSON format, and it can also test the COUNTER API. If the Validator gives you a fatal or critical error message about a file or an API, we encourage you to share that validation result with the publisher. In most cases you’ll be able to find the right contact email from the publisher’s Registry record.
Organising Your Data
If you want to compare across publishers and over time, you’re going to need to create an archive of the reports that you have harvested. Whether that’s in a business intelligence tool like Power BI or as a folder full of Excel files, make sure that you follow our rules of thumb.
- Download the relevant Reports (PR, DR, TR, IR) for each publisher that you work with, including all available attributes.
- Define and stick to a consistent naming scheme. For example, Report ID – Report Date – Vendor Name.
- Define and stick to a filing system, for example storing reports by publisher or by year.
- If you are going to analyse the data, it’s a good idea to work on a copy of the report, not the original. That way if you change your analysis process, you still have the original data to work from.
Analysing Your Data
There are lots of ways to work with data. If you’ve got a business intelligence tool, try exploring the different options for data modelling and visualisation. For those of you who are using spreadsheet tools, we’ve got some suggestions.
Filtering
Filtering is a very useful tool which allows you to rearrange, exclude or otherwise filter your usage reports to show only specific bits of information. Common examples within COUNTER are to filter a Title Report to show only those titles with Data Type Book, to filter a Database Report to show only search metrics without investigations or requests, and to filter an Item Report to show only items with Access Type Open. Filters can be combined, too, so you can get extremely granular if that’s what you want.
Simply adding a filter to Row 15 of your tabular file – that’s the column headers – will allow you to start playing with filters.
Pivot Tables
Tasha loves a pivot table: they’re a great way to quickly summarise big datasets of the kind you find in COUNTER reports, and they’re easy to turn into graphs or charts. Just stick your cursor into any cell of the report body, click ‘Insert > Pivot Table’ and you’re on your way.
Unlike filtering, pivot tables will allow you to easily total up different categories of data. Want to know how many Unique Item Investigations and Unique Item Requests there have been across all titles in a Title Report? Set up your pivot table to use Metric Type as the row and Reporting Period Total as the value, and you’ve got your answer.
Microsoft has a detailed guide to pivot tables if you’d like to learn more.
Common Questions That COUNTER Reports Can Answer
We work with a lot of libraries around the world. Here are some of the most common questions that they’re using COUNTER reports to answer, and how we’d answer them.
| Question | Our process |
|---|---|
| What is the most used journal from this publisher? | Filter the Title Report to Metric Type Unique_Item_Requests and Data Type Journal, then sort Metric Type from largest to smallest. The top row will be your most used journal. |
| Which databases are our students searching? | Filter the Database Report to show only search metrics. |
| Do we have enough simultaneous user licences for this database? | Filter the Database Report to Metric Type Limit Exceeded. If you’re seeing high denials, it might be time to up your user licence count. |
| Is there demand for older, archival journal content? | Set up a pivot table from the Title Report using YOP as the rows, with Metric Type as the columns, filtered to Unique Item Investigations and Unique Item Requests. If the archive content is being used, it’ll show up here. |
| What’s the trend for our full text usage (Requests) over the last five years? | Pull your Platform Reports from each of the years in question into a single file, then set up a pivot chart showing Metric Type Unique Item Requests by month or by year. |
| Which books would be the best ones to add to our collection as part of our evidence-based acquisitions? | Filter the Title Report to Metric Type No License and Data Type Book, then sort Metric Type from largest to smallest. The top row will be the books your staff and students are trying and failing to access. |
Combining COUNTER With Other Data Sources
To analyze data from different publishers in one place, you could copy the report body information from their respective reports into one sheet. Don’t forget to check that you are using the same report with the same configuration from each publisher before you start!
Not every question can be answered by COUNTER reports alone. If you want to calculate cost per use or make a decision on book purchases, for example, you’re going to need to draw on price lists as well as a COUNTER Report. Business intelligence tools are designed to combine multiple data sources, but it can be done in spreadsheet tools too.
One option is to cross-reference between common matching elements in different data sources. It’s essential to make sure the data is as complete and consistent as possible before you start. For example, if you wanted to match a book price list with a Title Report using the ISBN, you’re likely to need to remove hyphens before you start so that both files have the same ISBN format. Spreadsheet functions such as named ranges, XLOOKUP, SUMIF, and COUNTIF are helpful for these kinds of combinations.
As we said above, the COUNTER Academy goes into a lot more detail on working with COUNTER Reports. There’s a whole module on combining COUNTER with other data sources.