
METRICS
Usage, Search and Denials
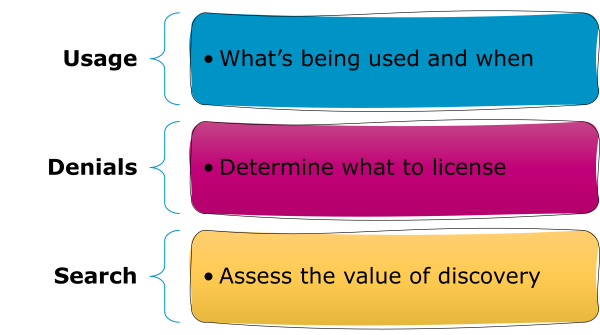
On this page you’ll find introductions to the three types of metrics in R5.1: usage metrics, search metrics, and access denials, as well as which metrics to use to answer different questions. You’ll learn about the difference between Investigations and Requests, whether those are total or unique, and how books and reference works are rolled up to show Title usage.

Introduction: What Are The COUNTER Metrics?
There are three flavours of metrics in R5.1: usage metrics, search metrics, and access denials. We’re often asked about the differences between metrics. One analogy that can be helpful is this: a publisher platform (website) is like a popular club. Search metrics represent the door count, usage metrics are people buying drinks at the bar, and access denials are the people turned away by the door staff for not meeting dress code.
Download Translations
Translations of the Friendly Guide are available in five languages, thanks to the generosity of members of the COUNTER community who provided funds and time to help us produce them.
- SpringerNature funded our Chinese translations
- Thieme sponsored German translations
- Gale covered the costs of our Spanish translations
- Thanks to the Couperin Consortium and the Canadian Research Knowledge Network for French translations
- And to Yuimi Hlasten at Denison College for Japanese translations
The Details
Usage Metrics
Usage metrics, unsurprisingly, reflect usage of content. We designed our usage metrics to allow you to compare usage patterns across different publisher platforms, no matter what type of content is delivered or what user experience designs have been put in place.
Investigations And Requests: Distinguishing Between Use Cases
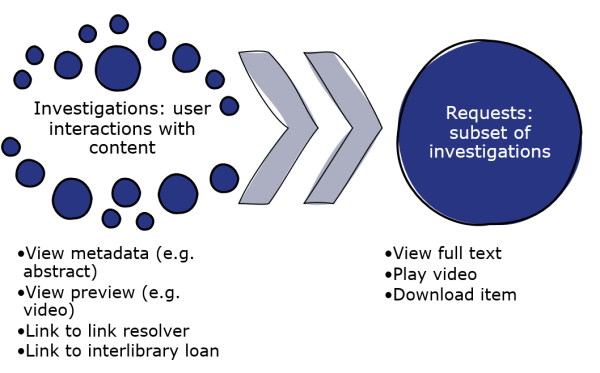
Every interaction with a piece of content on a platform is an Investigation. Some interactions are also Requests.
An Investigation might be an interaction with metadata (e.g. a book blurb or a video thumbnail), or use of a link such as one to inter-library loan.
An Investigation is also counted when a user interacts with the full record. That full-record activity is also counted as a Request. This means Requests are a subset of Investigations, tracked when a user interacts with the full record for a piece of content. Using the same examples as earlier, viewing or downloading a book chapter or watching a video would count as both Requests and Investigations.
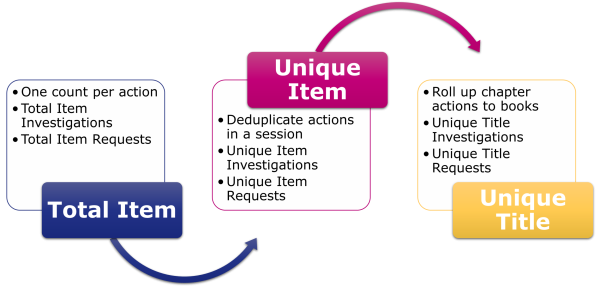
Total And Unique: Deduplicating For Accuracy
Investigations and Requests are reported in two ways: as Total counts and then as deduplicated Unique counts. Unique usage metrics mean that you can compare usage patterns across publisher platforms, no matter how the user interfaces are configured.
Let’s take an example where a user looks at an abstract for a journal article, and then decides to download the PDF of that article. The user has interacted with the same piece of content in two ways, meaning 2 Total Item Investigations. One of those interactions was with the full text of the article, so the publisher platform also needs to count 1 Total Item Request. If the same user was looking at a journal article which automatically displayed the full text as HTML, and still decided to download the PDF, there would still be 2 Total Item Investigations, but there would also be 2 Total Item Requests. To avoid inflating usage counts just because of the user interface, we ask publishers to collapse Total counts for each item in each session down to one Unique metric. In the example here, that means both platforms must show only 1 Unique Item Investigation and 1 Unique Item Request.
Item And Title: Books Are A Special Case
Our usage metrics are mostly associated with individual pieces of content (Items), but we treat books and reference works as a special case. For books and reference works, Unique Investigations and Requests are rolled up to Title metrics.
If we take an example where a user reads the abstracts for and then downloads PDFs for three chapters in the same book, we would have: 6 Total Item Investigations (one per chapter for the abstracts and the PDFs); 3 Total Item Requests; 3 Unique Item Investigations; 3 Unique Item Requests; 1 Unique Title Investigation; and 1 Unique Title Requests.
So we have six usage metrics:
- Total Item Investigations and Total Item Requests apply at the level of the item and count every interaction.
- Unique Item Investigations and Unique Item Requests also apply at the level of the item, but roll up the total counts to only show one interaction per user session.
- Unique Title Investigations and Unique Title Requests condense the unique counts even further, to show just one interaction per user session per book.
A Usage Metrics Scenario
Let’s assume that a publisher platform offers journals, books (downloadable as both whole books and chapter-by-chapter) and multimedia. During a single visit, one user reads a journal article’s abstract and then downloads the PDF; visits a book blurb and then downloads the whole 17-chapter book; and watches a video. That would result in the following usage counts:
| Journal | Book | Video | |
| Total Item Investigations | 2 | 18 | 1 |
| Unique Item Investigations | 1 | 18 | 1 |
| Total Item Requests | 1 | 17 | 1 |
| Unique Item Requests | 1 | 17 | 1 |
| Unique Title Investigations | 1 | ||
| Unique Title Requests | 1 |
Search Metrics
There are four types of search metric in R5.1.
Searches Platform appears in the Platform Report, and it reports on searches at the level of the platform. That means only one search is counted, no matter how many databases are on the platform. Searches Platform also gets counted when users land on search-driven topic pages, or other types of content collection that are populated by pre-configured searches. Landing on static collections, like a special issue with a fixed table of contents, does not count as a search.
Searches Regular and Searches Automated are often confused. Both of these metrics appear in the Database Report. They show the number of searches happening within a single database. They are different:
- Searches Regular will always show up in the Database Report where there’s only one database on the publisher platform. Platforms that have multiple databases also use Searches Regular, but only if the user is allowed to choose which database(s) to search.
- Searches Automated is the alternative to Searches Regular. It’s used for platforms that have multiple database where the user cannot choose which database(s) to search.
The fourth search metric is Searches Federated. It shows where searches have been run remotely, for example where a library management system can remotely query the publisher platform. It applies on a per-database level and appears in the Database Report.
A Search Metrics Scenario
In this case, our publisher platform offers three databases. During a single visit, one user conducts three searches across the whole platform and then one search just on database 3. That gives us the following usage counts:
| Platform A | Database 1 | Database 2 | Database 3 | |
| Searches Platform (in the PR) | 4 | |||
| Searches Regular | 3 | 3 | 4 | |
| Searches Automated | ||||
| Searches Federated |
The same user then visits a different publisher platform with two other databases, and conducts five more searches. This platform does not permit the user to restrict their search, resulting in the following usage counts:
| Platform B | Database 4 | Database 5 | |
| Searches Platform (in the PR) | 5 | ||
| Searches Regular | |||
| Searches Automated | 5 | 5 | |
| Searches Federated |
Denial Metrics
Access denials are sometimes known as turnaways. We have two varieties in R5.1.
- No License denials are counted where a user cannot access something because their institution does not have a license to the content
- Limit Exceeded denials are tracked where a user cannot access something because their institution’s cap on the number of simultaneous users has been exceeded.
One common pattern for denial metrics is seen on subscription journals. Users can read the freely available metadata (title, authors, abstract), but are denied access to the full article. If a user looks at the free metadata page and then clicks on the PDF button, the publisher platform would need to count 1 Total Item Investigation and 1 No License. If the platform would usually automatically display the full text as HTML, but has fallen back to the metadata because the user doesn’t have a subscription, that would also be 1 Total Item Investigation and 1 No License.
Just like usage, denials are counted at the level of the item. If a user lands on a book table of contents page and tries to download the EPUB file for the whole book, we know that would generate one Investigation and one Request for each chapter. If the user’s institution did not have access to the book, the publisher platform would need to count 1 No License for each chapter.
Which Metrics Should I Use?
Metrics For Calculating Cost Per Download
We usually recommend using Unique Item Requests for calculating cost per download (CPD), sometimes called cost per use. If you are calculating CPD for subscription content, divide your annual spend by the Unique Item Requests for that year. If you are calculating CPD for a book, you should use the Unique Title Requests instead. That means the CPD for books is to divide the purchase price by the Unique Title Requests since the purchase date.
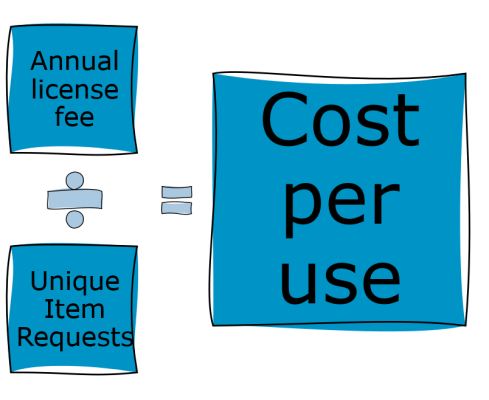
If you are calculating CPD for open access materials, you’ll want to use the Unique Item Request count from a Global Item Report – there’s more information about that in the Friendly Guide to COUNTER and Open Access.
Understanding The Value Of Databases
Many librarians use a combination of metrics to gain a clearer understanding of the value of their database holdings. Searches Platform is great for highlighting the total traffic to a platform (remember that door count?). For abstracting and indexing databases, which don’t have full text, Unique Item Investigations offers an insight into how useful the search results might be.
Acquisition Decisions
Access denials can be valuable in acquisition decisions. High No License counts might suggest that users from an institution need resources that aren’t within their holdings. In contrast, being able to show that there aren’t many denials could help librarians push back against acquisitions that might not be a priority for their users.