
REPORTS
Platform, Database, Title and Item
Learn about the four COUNTER Reports: Platform, Database, Title and Item Reports. We designed the four Reports to be comprehensive and offer maximum flexibility for working with usage metrics. The guide highlights how the COUNTER Reports fit together and which to choose for different reporting needs.You’ll also learn about the derivative standard views of the Reports, and why we don’t recommend using them!

Introduction: What Are The COUNTER Reports?
There are four COUNTER Reports. The COUNTER Reports are designed to be comprehensive and offer maximum flexibility in working with metrics. The standard views associated with the COUNTER Reports are pre-set summaries of particular types of activity. We developed the standard views to help libraries make the transition from Release 4 to Release 5. They are deliberately limited to mimic the old R4 reports, and exclude a great deal of valuable information. For example, the TR_J1 standard view only shows usage for Controlled (subscription) content. Standard views typically only show a small subset of metrics, and often are focused on only one or two Data Types.
You can view full samples of all the COUNTER Reports in Appendix G of the Code of Practice. The tables provided below are deliberately short to make them easier to read.
Download Translations
Translations of the Friendly Guide to Changes in Release 5.1 are available in five languages, thanks to the generosity of members of the COUNTER community who provided funds and time to help us produce them.
- SpringerNature funded our Chinese translations
- Thieme sponsored German translations
- Gale covered the costs of our Spanish translations
- Thanks to the Couperin Consortium and the Canadian Research Knowledge Network for French translations
- And to Yuimi Hlasten at Denison College for Japanese translations
The Details
Platform Reports
The Platform Report, or PR, is a high-level view of all activity on a platform (that’s the term we use for publisher websites). It includes COUNTER usage and search metrics, broken down by Data Type as standard and by Access Method on request. If you aren’t sure about the metrics, the Friendly Guide to COUNTER Metrics is a good place to start.
Let’s take an example where a platform includes books, journals, and multimedia. In the PR, you would see three levels of granularity:
- Column B of the tabular report is for Data Type, and for our example platform you would see Data Types Book, Journal and Multimedia.
- Within each Data Type, you can identify the Access Method (Regular human usage, or TDM) in column C of the tabular report. It only shows up if you have requested Access Method as part of your report.
- Beneath each Data Type and Access Method combination, you’ll see a separate row of the Report for each Metric Type in column D of the tabular report.
- And of course, there’s the option to look either at total usage over the reporting period, or a month-by-month breakdown for each metric.
Table 1. A very simplified Platform Report showing only one Metric Type. Remember, a full sample is available in the Code of Practice!
| Platform | Data Type | Access Method | Metric Type | Reporting Period Total |
| Website A | Book | Regular | Unique Item Requests | 16 |
| Website A | Journal | Regular | Unique Item Requests | 59 |
| Website A | Journal | TDM | Unique Item Requests | 698 |
| Website A | Multimedia | Regular | Unique Item Requests | 12 |
| … | … | … | … |
Limitations of Platform Reports
A PR will always split out usage by Data Type, but nothing more granular. That means you won’t see separate information for individual journals or books in a PR, so this isn’t the report to use if you want to know usage of a particular title! The PR doesn’t allow you to see Access Type, so you won’t know whether the usage is for Controlled, Open or Free To Read content. And the PR excludes COUNTER’s denial metrics (No License and Limit Exceeded), so you can’t use it to assess turnaways.
Standard Views of Platform Reports
There’s only one standard view of the Platform Report. It’s called Platform Usage, or PR_P1. It filters the PR to show only three metrics: Total Item Requests, Unique Item Requests, and Searches Platform.
Database Reports
The Database Report, or DR, shows activity for specific databases on a platform. It includes COUNTER usage, search and denial metrics, with key information about the database itself. broken down by Data Type as standard and by Access Method on request.
In the DR, you’d see the same levels of granularity as for a PR:
- Column F of the tabular report is for Data Type.
- Within each Data Type, the Access Method is in column G of the tabular report (included on request).
- Beneath each Data Type and Access Method combination, there is a separate row of the Report for each Metric Type in column H of the tabular report.
- And again, there’s the option to look either at total usage over the reporting period, or a month-by-month breakdown for each metric.
DRs also include metadata about the database itself, the platform, and the publisher, in columns A to E of the tabular report.
Table 2. A very simplified Database Report for a Full Content Database, excluding the database metadata, and showing only one Data Type plus search metrics. Remember, a full sample is available in the Code of Practice.
| Database | Database Metadata | Data Type | Access Method | Metric Type | Reporting Period Total |
| Database B | … | Database Full | Regular | Searches Regular | 352 |
| Database B | … | Database Full Item | Regular | Total Item Investigations | 113 |
| Database B | … | Database Full Item | Regular | Unique Item Investigations | 98 |
| Database B | … | Database Full Item | Regular | Total Item Requests | 83 |
| Database B | … | Database Full Item | Regular | Unique Item Requests | 81 |
| Database B | … | Database Full Item | Regular | No License | 2 |
| … | … | … | … | … |
Limitations of Database Reports
As with PR, the DR doesn’t allow you to see Access Type, so you won’t know whether the usage is for Controlled, Open or Free To Read content. Also like the PR, the DR is split by Data Type, but nothing more granular.
Standard Views of Database Reports
There are two Standard Views of the Database Report:
- Database Search and Item Usage (DR_D1) filters the DR to show Total and Unique Item Investigations, and Total and Unique Item Requests, plus Searches.
- Database Access Denied (DR_D2) filters the DR to show denials, also known as turnaways. Databases which don’t turn users away, typically OA databases, do not track denials and don’t need to offer the DR_D2.
Title Reports
Title is a term we use frequently within COUNTER. It includes books and journals, but also conference proceedings, reports, theses, and other such materials. You can find out more about titles in the Data Type section of the Friendly Guide to COUNTER Attributes, Elements, and Other (Slightly) Techy Things.
The Title Report (TR) is where our reports become quite granular, as the TR shows activity for specific titles on a platform. It includes COUNTER usage and denial metrics as well as key information about the title (e.g. ISBN or ISSN), the platform, and the publisher. The TR includes more attributes than the PR or DR so it can be broken down in more ways:
- Columns A to J of the tabular report are title metadata.
- Column K of the tabular report is for Data Type.
- Column L is YOP, or Year of Publication (where requested). This is particularly valuable for journals and other serialised titles like newspapers.
- You’ll find Access Type (Controlled, Open, or Free To Read) in column M of the tabular report, when it’s been requested.
- Within each Data Type and YOP, you can identify the Access Method in column N of the tabular report, again where requested.
- Nested another level down in column N are the separate rows of the Report for each Metric Type.
- And of course, there’s the option to look either at total usage over the reporting period, or a month-by-month breakdown for each metric.
Table 3. A very simplified Title Report for an eJournal and eBook platform, excluding the title metadata, and showing only one Access Method and one usage metric. TR is a lengthy report, so the full sample available in the Code of Practice will be valuable in understanding it.
| Title | Title Metadata | Data Type | YOP | Access Type | Access Method | Metric Type | Reporting Period Total |
| Title C | … | Book | 2022 | Controlled | Regular | Unique Item Requests | 15 |
| Title C | … | Book | 2022 | Controlled | Regular | Unique Item Requests | 48 |
| Title D | … | Journal | 2026 | Controlled | Regular | Unique Item Requests | 319 |
| Title D | … | Journal | 2026 | Open | Regular | Unique Item Requests | 547 |
| … | … | … | … | … | … | … | … |
Limitations of the TR
The main limitation of the TR is that you need to remember to request YOP, Access Type and Access Method if you want to really dig into usage details. They aren’t default fields, so you’ll only see them if you request them.
Standard Views of Title Reports for Books and Reference Works
There are three Standard Views of the Title Report for books and reference works, or sections within books and reference works:
- Book Requests (Controlled) (TR_B1) filters the TR to show Total Item Requests and Unique Title Requests for Controlled (i.e. subscriber-only) books and reference works or sections within them.
- Book Access Denied (TR_B2) filters the TR to show access denials to books and reference works or sections within them. Platforms which don’t turn users away, typically OA publishers, do not track denials and don’t need to offer the TR_B2.
- Book Usage by Access Type (TR_B3) filters the TR to show all relevant metrics for books, broken down by Access Type so that Controlled, Open, and Free To Read books and reference works or sections within them can be clearly distinguished.
Standard Views of Title Reports for Journals
There are also four Standard Views of the Title Report for journals:
- Journal Requests (Controlled) (TR_J1) filters the TR to show Total Item Requests and Unique Item Requests for Controlled articles within journals.
- Journal Access Denied (TR_J2) filters the TR to show access denials to articles within journals. As for other denial-focused standard views, platforms which don’t turn users away don’t need to offer the TR_J2.
- Journal Usage by Access Type (TR_J3) filters the TR to show all relevant metrics for articles within journals, broken down by Access Type so that Controlled, Open, and Free To Read usage can be clearly distinguished.
- Journal Requests by YOP (Controlled) (TR_J4) is a more granular view of TR_J1 that includes a breakdown by year of publication.
Item Reports
Item is another common term in COUNTER. It includes things like articles, videos, book sections, database records and so on. You can find out more about Items in the Data Type section of the Friendly Guide to COUNTER Attributes, Elements, and Other (Slightly) Techy Things.
The Item Report, or IR, is very granular, showing every applicable COUNTER metric for every single item on a platform, with a lot of information about the item itself (e.g. identifier, parent title if any). It is broken down by Data Type as standard, but also by Access Type, Access Method, and year of publication (YOP) on request. There’s a lot of metadata fields in the IR:
- Metadata about the Item itself, including the publisher and identifiers, as well as author details on request.
- Information about the Item’s parent, where that’s relevant and requested. For example, an Item that is a Book Segment will have a Parent that is a Book.
- Occasionally, information about sub-units of the Item, which we call Components. For example, a video embedded within a Book Segment.
The IR is so extensive that it’s not practical to provide a tabular view here. Please go and download the full sample from the Code of Practice – it’s available in two tabular formats (.tsv and .xlsx) and in our JSON format.
Limitations of Item Reports
IR is so very large that it can be difficult to work with. It’s also not a required Report for most publishers, so it’s not as commonly available.
Standard Views of Item Reports
There are two Standard Views of the Item Report:
- Multimedia Item Requests (IR_M1) filters the IR to show only items with Data Type Multimedia, or the more granular multimedia types of Audiovisual, Image, Interactive Resource and Sound.
- Journal Article Requests (IR_A1) filters the IR to show only items with Data Type Article.
Which report should I use?
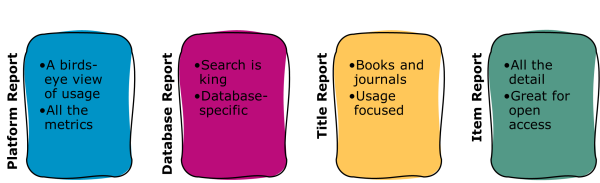
We always recommend using one of the four COUNTER Reports – Platform, Database, Title, or Item – as these give you lots of options for working with the data. Typically the Database and Title Reports offer the best balance of granularity with a usable amount of information. By contrast the Platform Report is best suited for a birds-eye view of usage, while the Item Report is excellent for extremely granular data analysis.
All COUNTER Reports can be filtered easily, and we have produced the Friendly Guide to Working With COUNTER Reports to highlight how that works. There’s a downloadable guide about why we do not recommend using standard views. If you really want to use a standard view, make sure you choose one that is appropriate for your needs. If you want to know about usage of open access articles, for example, using the TR_J1 isn’t helpful!
What about open access?
We recommend using the Global Item Report for checking on OA usage. That’s covered in a lot more detail in the Friendly Guide to COUNTER and Open Access. While not mandatory, we recommend that every platform with OA content should offer the Global Item Report.
Who needs to supply the various COUNTER Reports?
R5.1, like earlier versions of the Code of Practice, includes information about which reports different types of platform should provide. This is done using the Host Type. There’s a downloadable guide linking Reports, Host Types and Data Types. The COUNTER Registry includes information about platforms’ Host Types, so if you want to know what reports to expect from a specific platform check out registry.countermetrics.org.